Need help ?
Data Analysis
Data Analysis is the process of systematically applying statistical and/or logical techniques to describe and illustrate, condense and recap, and evaluate data. The procedure helps reduce the risks inherent in decision-making by providing useful insights and statistics, often presented in charts, images, tables, and graphs.

- SaI Data Science. What Is Data?

Source: The image above was generated using AI tools (e.g., Gemini and ChatGPT) based on specified prompts
1. Descriptive analysis involves summarizing and describing the main features of a dataset. It focuses on organizing and presenting historical data in a meaningful way, often using measures such as mean, median, mode, and standard deviation. It provides an overview of the data and helps identify patterns or trends.
Use case: Understanding “what happened”
Examples:
- Average monthly sales for a retail store.
- Most common diagnoses in a hospital.
- Website traffic trends over the past year.
Learn More:
2. Exploratory Data Analysis (EDA) EDA focuses on exploring and understanding the data without preconceived hypotheses. It involves visualizations, summary statistics, and data profiling techniques to uncover patterns, relationships, and interesting features. It helps generate hypotheses for further analysis.
Use Case: Generating new insights or hypotheses.
Examples:
- Visualizing age distribution of patients.
- Detecting anomalies in financial transactions.
- Correlation between ad spend and engagement.
Learn More:
3. Inferential analysis aims to make inferences or predictions about a larger population based on sample data. It involves applying statistical techniques such as hypothesis testing, confidence intervals, and regression analysis. It helps generalize findings from a sample to a larger population.
Use Case: Drawing conclusions beyond the observed data.
Examples:
- Estimating disease prevalence from surveys.
- Testing if a new teaching method improves scores.
- Election polling to infer voter preferences.
Learn More:
4. Diagnostic analysis aims to understand the cause-and-effect relationships within the data. It investigates the factors or variables that contribute to specific outcomes or behaviors. Techniques such as regression analysis, ANOVA (Analysis of Variance), or correlation analysis are commonly used.
Use Case: Understanding “why it happened.”
Examples:
- Investigating why revenue dropped in a region.
- Analyzing why patient readmission rates increased.
- Diagnosing system failures based on log data.
Learn More:
5. Predictive analysis involves using historical data to make predictions or forecasts about future outcomes. It utilizes statistical modeling techniques, machine learning algorithms, and time series analysis to identify patterns and build predictive models. It is often used for forecasting sales, predicting customer behavior, or estimating risk.
Use Case: Predicting “what is likely to happen.”
Examples:
- Predicting next month’s sales.
- Forecasting patient admission rates.
- Credit risk scoring.
Learn More:
6. Prescriptive analysis goes beyond predictive analysis by recommending optimal actions or decisions based on the predictions (What should we do?). It combines historical data, optimization algorithms, and business rules to provide actionable insights and maximize desired outcomes.
Use Case: Suggesting “what should we do.”
Examples:
- Suggesting optimal inventory levels.
- Recommending treatment plans based on predictive models.
- Portfolio optimization strategies.
Learn More:

Source: The image above was generated using AI tools (e.g., Genimi and ChatGpt) based on specified prompts
|
Type |
Qualitative Data Analysis |
Quantitative Data Analysis |
|
Description |
Derives data via words, symbols, pictures, and observations. This method doesn’t use statistics. |
Also known as statistical data analysis methods, quantitative approaches collect raw data and process it into numerical data. |
|
Common Methods
|
Content Analysis: For analyzing behavioral and verbal data. Narrative Analysis: For working with data culled from interviews, diaries, and surveys. Grounded Theory: For developing causal explanations of a given event by studying and extrapolating from one or more past cases. |
Hypothesis Testing: For assessing the truth of a given hypothesis or theory for a data set or demographic. Mean (average): Determines a subject’s overall trend by dividing the sum of a list of numbers by the number of items on the list. Sample Size Determination: Uses a small sample taken from a larger group and analyzed. The results gained are considered representative of the entire body. |
Data Visualization and Its Types
Data visualization is the graphical representation of information and data. By using visual elements like charts, graphs, and maps, data visualization tools provide an accessible way to see and understand trends, outliers, and patterns in data. Data visualization is commonly used for idea generation and illustration, so as to help teams and individuals convey data more effectively to colleagues and decision-makers. Frequently used types of data visualizations are listed in the following tabs.

Source: Johns Hopkins Bloomberg School of Public Health. (2024).Introduction to Data Visualization in R.
A bar chart is one of the most commonly used forms to present quantitative data. It is simple to create and to understand. It is best used when comparing data from different categories. A bar chart is simple: We usually have a few values – ordered as categories on the x or y axis. Then we have the values expressed as bars (horizontal) or columns (vertical). The extent of the bars is the value.
Bar Chart of Race & Ethnicity in New York (2015)
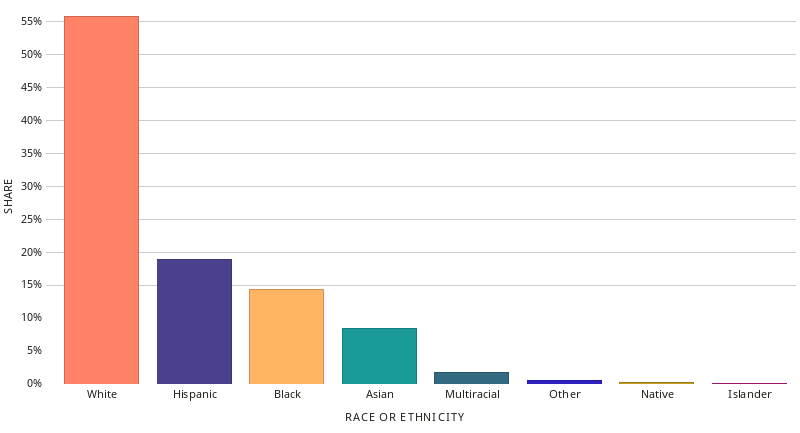
Datawheel, CC0, via Wikimedia Commons
A pie chart is used to display the proportions of a whole. These charts are useful for percentages. When making a pie chart, please note:
- All portions should add up to a total of 100%.
- Sizes of the portions should represent their value.
- Avoid using too many variables.

A line chart is a type of chart used to show information that changes over time. We plot line charts using several points connected by straight lines. The line chart comprises two axes known as the 'x' axis and 'y' axis. The horizontal axis is known as the x-axis.

A scatter plot is a type of plot or diagram to display values for typically two variables for a set of data.
Scatter plots show whether there is a relationship between two variables. The trend line shows the central tendency of the data.

Yi, M. (2019). A complete guide to scatter plots. Retrieved February, 25, 2021.
A box plot or boxplot is a method for graphically depicting groups of numerical data through their quartiles. Box plots may also have lines extending from the boxes indicating variability outside the upper and lower quartiles.

Michelson experiment (1881)
Data Analysis and Visualization Resources and Tools
📊 Research Data Services Department
Need help with data analysis or visualization? Our team is here to support you.
📍 Location: ALK 452
We assist with:
- Identify appropriate tools for analyzing and visualizing your data
- Determine which types of analysis & visualizations best fit your research or presentation needs
- Provide guidance on interpreting the data analysis results
- Provide tips on creating your visualization
📚 Other Resources on Campus
- The AI Curriculum Modules at Texas State University are an initiative by the Center for Analytics and Data Science (CADS), developed with funding from our NSF Expand AI grant. These modules are designed to enhance AI education across disciplines, offering introductory, foundational and domain specific content.
- Python for AI is an introduction to Python programming with a focus on data analysis and visualization offers students learn to create and manipulate variables, work with data types, and use basic data structures like lists and dictionaries. The course covers essential programming concepts, including flow control structures (if, else, while, for) for building simple algorithms. Exploration of Python libraries, particularly Pandas, for data importation, manipulation, and analysis. Understanding the data visualization using Pandas and Matplotlib
- Department of Sociology Statistics Tutoring Lab provides tutoring support for students working with statistical methods in sociology and related fields.
- The Data Analytics and Research Methodology (DARM) service in the Division of Research also provides faculty with up to six hours of free consulting and may access additional hours through contract consulting.
- The Collaborative Learning Center (CLC) offers tutoring in math and statistics.
- Math CATS offers tutoring in math and statistics.
📖 Open Access E-books
- Data Visualization: Schwabish, J. (2021). Better data visualizations: A guide for scholars, researchers, and wonks. Columbia University Press. https://www.jstor.org/stable/10.7312/schw19310
- Data Analysis: Ross, S. M. (2017). Introductory statistics. Academic Press. The course textbook is available for download free of charge from OpenStax at https://openstax.org/details/introductory-statistics.
What is R? What is RStudio?

R is more of a programming language than just a statistics program. It is “a language for data analysis and graphics.” You can use R to create, import, and scrape data from the web; clean and reshape it; visualize it; run statistical analysis and modeling operations on it; text and data mine it; and much more.
RStudio is a user interface for working with R. It is called an Integrated Development Environment (IDE): a piece of software that provides tools to make programming easier. RStudio acts as a sort of wrapper around the R language.
Install R and RStudio
R and RStudio are two separate pieces of software:
- R is a programming language that is especially powerful for data exploration, visualization, and statistical analysis
- RStudio is an integrated development environment (IDE) that makes using R easier. In this course we use RStudio to interact with R.
Windows
- Download R from the CRAN website.
- Run the
.exefile that was just downloaded - Go to the RStudio download page
- Under Installers select RStudio x.yy.zzz - Windows Vista/7/8/10 (where x, y, and z represent version numbers)
- Double click the file to install it
- Once it’s installed, open RStudio to make sure it works and you don’t get any error messages.
MacOS
- Download R from the CRAN website.
- Select the
.pkgfile for the latest R version - Double click on the downloaded file to install R
- It is also a good idea to install XQuartz (needed by some packages)
- Go to the RStudio download page
- Under Installers select RStudio x.yy.zzz - Mac OS X 10.6+ (64-bit) (where x, y, and z represent version numbers)
- Double click the file to install RStudio
- Once it’s installed, open RStudio to make sure it works and you don’t get any error messages.
Open Access e-book: Grolemund, G. (2014). Hands-on programming with R: Write your own functions and simulations. " O'Reilly Media, Inc.".
What is Python?
![]()
Python is a high-level, general-purpose programming language. Its design philosophy emphasizes code readability with the use of significant indentation. Python is dynamically typed and garbage-collected. It supports multiple programming paradigms, including structured (particularly procedural), object-oriented, and functional programming. It is often described as a “batteries included” language due to its comprehensive standard library.
- from Wikipedia
Installation Guide
Mac (macOS)
- Go to the Python Downloads page for macOS.
- Download the latest macOS installer (universal2 or Intel/Apple Silicon as appropriate).
- Double-click the downloaded
.pkgfile and follow the on-screen instructions. - After installation, open Terminal and type
python3 --versionto confirm installation. - Optional: Install a package manager like Homebrew and run
brew install pythonfor easier updates.
Windows
- Go to the Python Downloads page for Windows.
- Click the latest Windows installer (64-bit) and run the downloaded
.exefile. - Important: Check the box that says "Add Python to PATH" before clicking Install Now.
- After installation, open Command Prompt and type
python --versionto confirm installation. - You can also manage Python versions using Miniconda or pyenv-win.
Open Access e-book: Introduction to Python Programming - OpenStax
Open access Canvas Module available for TXST affiliates:
Python for AI is an introduction to Python programming with a focus on data analysis and visualization offers students learn to create and manipulate variables, work with data types, and use basic data structures like lists and dictionaries. The course covers essential programming concepts, including flow control structures (if, else, while, for) for building simple algorithms. Exploration of Python libraries, particularly Pandas, for data importation, manipulation, and analysis. Understanding the data visualization using Pandas and Matplotlib
![]()
NVivo is a software program used for qualitative and mixed-methods research. Specifically, it is used for the analysis of unstructured text, audio, video, and image data, including (but not limited to) interviews, focus groups, surveys, social media, and journal articles.
Installation Guide
Mac (macOS)
- Go to the NVivo official website.
- Click Free Trial or Buy Now to access the download options (you may need to create a Lumivero account).
- Choose the macOS installer and download the
.dmgfile. - Double-click the downloaded file and drag the NVivo icon into your Applications folder.
- Open NVivo from Applications, sign in with your Lumivero account, and activate your license or trial key.
Windows
- Go to the NVivo official website.
- Select Free Trial or Buy Now to access the download options (login or create a Lumivero account if required).
- Download the Windows installer (
.exefile) and run it. - Follow the on-screen instructions to complete installation.
- After installation, launch NVivo, sign in with your Lumivero account, and activate using your license or trial key.
With Tableau, users can upload data from spreadsheets, cloud-based data management software, and online databases and merge them to identify trends, filter databases, and forecast outcomes. Users also can drag and drop information to transform data and instantly create charts and visualizations. Start your free trial of Tableau here.


Google’s free Charts software creates customizable charts, maps, and diagrams from imported datasets.

AntConc is a freeware, multiplatform tool for carrying out corpus linguistics research, introducing corpus methods, and doing data-driven language learning. It runs on any computer running Microsoft Windows (built on Win 10), MacOS (built on Mac Catalina), and Linux (built on Linux Mint). It is developed in Python and Qt using the PyInstaller compiler to generate executables for the different operating systems. It uses SQLite as the underlying database.
![]()